
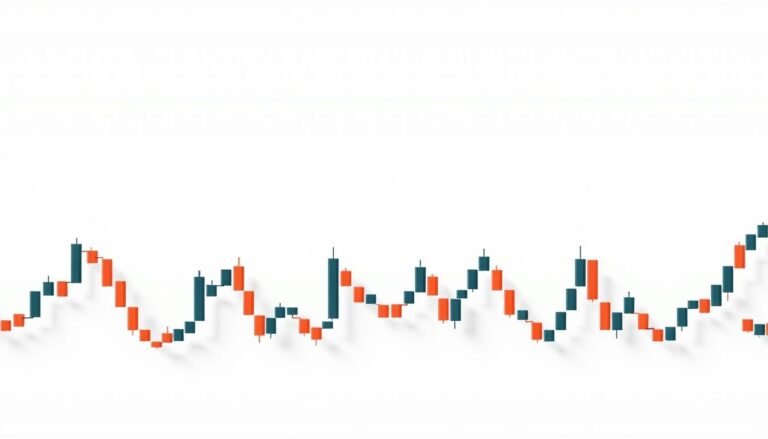
Crypto Candlestick Patterns Explained
We introduce how candlestick charts compress open, high, low, and close into visual signals that help us read price movement quickly across digital asset markets. These visual bars trace back to Japanese rice trader Munehisa Homma and found a wider audience after Steve Nison’s 1991 book. Adobe’s overview helps us name bodies, shadows, and color […]
Crypto Candlestick Patterns Explained Read More »